Benchmark is equipped with a comprehensive Geographic Information System composed of the latest industry standard software, field DGPS units, professionally-trained technicians, and numerous accessory sensors. These capabilities are integral to successfully conducting our field activities and allow precise sample locating and recording capabilities. This allows ready collaboration and data dissemination with partners and clients.
Wetlands and Permitting
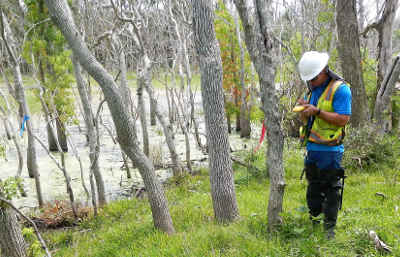
GIS is used extensively in the course of our wetland determinations. Prior to conducting a field investigation, GIS is used to map project bounds and compare site conditions with historical observations of the landscape. The use of sub-meter precision field GPS units allows for accurate tabulation of wetland acreage which is identified and recorded during field assessments.
After collecting information about wetland geographies, the data is processed and mapped in order to visualize particular areas of concern for potential projects. The final datasets can be converted to a number of formats as requested by clients utilizing differing analysis methods such as CAD.
Oil and Gas
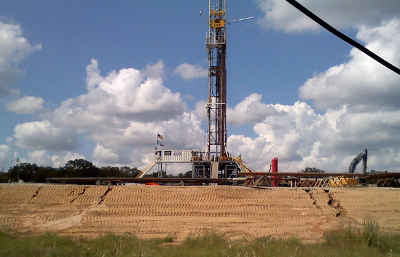
Prior to conducting field site assessments of potential well pads or gas pipelines and frac ponds, our GIS technicians gather data including aerial photographs, Threatened and Endangered Species Occurrence data, flood zone, jurisdictional waters, wetlands and lease boundary data in order to support environmental decisions.
These variables are of concern when locating these projects to ensure that environmental laws are not broken or infringed upon, and the environment is not harmed. Those variables can result in costly fines or project delays. With the risk of potential shut-downs, many clients gladly request our quick and efficient site reviews in order to maintain project scheduling and viability concerning issues outside their expertise.
Environmental Sampling
GIS is used prior to field sampling to plot proposed sample stations, review aerial photographs, and identify access issues. Historical imagery can be used to supplement knowledge of site usage conditions as well as potential historic pathways of contaminant migration.
Light Detection And Ranging (LIDAR) point clouds and Digital Raster Graphics (DRG) is often analyzed to characterize vegetative communities that may have existed at a study site before remediation, or land usage change efforts have occurred. Upon completion of field studies, GIS is used to plot actual sample stations, present field data, and provide figures for reports.
Bathymetry Studies
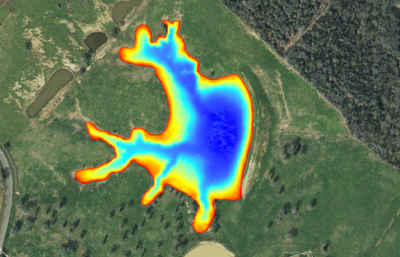
Point-cloud datasets collected by field technicians using fathometers and manual measurements can be precisely interpolated to produce datasets of bathymetric surfaces as well as value-based contours to aid in visualization of bathymetric features, volumetric calculations, and contaminant migration routes. Bathymetry is often employed to calculate sediment and water volumes for dredging and contested frac water usage.
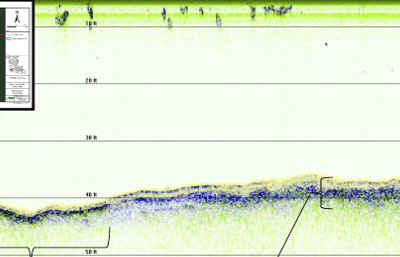
Benchmark is equipped to conduct surveys with a variety of acoustic frequencies. Depending on the application, high frequency sonar impulses may be employed to analyze surface sediments. Lower frequencies may be chosen to observe more consolidated layers of the benthic habitat. Bathymetry surveys can provide information about shoaling rates in navigable bodies of water such as shipping channels or common community lakes. A robust understanding of geographic and vertical datums as well as acoustic physics is paramount to the success and integrity of our surveys. Professionally trained geographers on staff help assure this success.
